بلاگ

  • New Android Vitals Metrics are here


    Posted by Karan Jhavar – Product Manager, Android Frameworks, and Dan Brown – Product Manager, Google Play

    Android has long championed performance, continuously evolving to deliver exceptional user experiences. Building upon years of refinement, we’re now focusing on pinpointing resource-intensive use cases and developing platform-level solutions that benefit all users, across the vast Android ecosystem.

    Since the launch of Android vitals in Play Console in 2017, Play has been investing in providing fleet-wide visibility into performance issues, making it easier to identify and fix problems as they occur. Today, Android and Google Play are taking a significant step forward in partnership with top OEMs, like Samsung, leveraging their real-world insights into excessive resource consumption. Our shared goal is to make Android development more streamlined and consistent by providing a standardized definition of what good and great looks like when it comes to technical quality.

    “Samsung is excited to collaborate with Android and Google Play on these new performance metrics. By sharing our user experience insights, we aim to help developers build truly optimized apps that deliver exceptional performance and battery life across the ecosystem. We believe this collaboration will lead to a more consistent and positive experience for all Android users.”

    Samsung

    We’re embarking on a multi-year plan to empower you with the tools and data you need to understand, diagnose, and improve your app’s resource consumption, resulting in happier and more engaged users, both for your app, and Android as a whole.

    Today, we’re launching the first of these new metrics in beta: excessive wake locks. This metric directly addresses one of the most significant frustrations for Android users – excessive battery drain. By optimizing your app’s wake lock behavior, you can significantly enhance battery life and user satisfaction.

    The Android vitals beta metric reports partial wake lock use as excessive when all of the partial wake locks, added together, run for more than 3 hours in a 24-hour period. The current iteration of excessive wake lock metrics tracks time only if the wake lock is held when the app is in the background and does not have a foreground service.

    These new metrics will provide comprehensive, fleet-wide visibility into performance and battery life, equipping developers with the data needed to diagnose and resolve performance bottlenecks. We have also revamped our wake lock documentation which shares effective wake lock implementation strategies and best practices.

    In addition, we are also launching the excessive wake lock metric documentation to provide clear guidance on interpreting the metrics. We highly encourage developers to check out this page and provide feedback with their use case on this new metric. Your input is invaluable in refining these metrics before their general availability. In this beta phase, we’re actively seeking feedback on the metric definition and how it aligns with your app’s use cases. Once we reach general availability, we will explore Play Store treatments to help users choose apps that meet their needs.

    Later this year, we may introduce additional metrics in Android vitals highlighting additional critical performance issues.

    Thank you for your ongoing commitment to delivering delightful, fast, and high-performance experiences to users across the entire Android ecosystem.


    Source link

  • Smart Hiring Tactics From a James Beard Award Nominee

    Smart Hiring Tactics From a James Beard Award Nominee


    Opinions expressed by Entrepreneur contributors are their own.

    Located in the heart of Portland, Maine, Sur Lie is a James Beard Award-nominated tapas restaurant with a menu spearheaded by chef Mimi Weissenborn, a recently announced contestant on Bravo’s Top Chef.

    While Weissenborn takes the helm in the kitchen, owner and James Beard Award semifinalist Krista Cole works behind the scenes to ensure a smooth service night after night. She first opened the restaurant out of her love for tapas and wine pairings, filling a gap she couldn’t find in Portland. Then, Weissenborn came along and changed the game. Now, their unique dynamic is a key component to their success at Sur Lie.

    “[We’re] this incredible dynamic duo,” Cole says. “I’m very data-oriented, organized and efficient, and she’s the brilliant, creative brain that comes up with the menu, which is why people come into Sur Lie as well. We have a really good relationship that way. As women in the industry trying to break down barriers, we focus on what we’re both really good at and how to complement each other.”

    Related: This CEO’s Paint-Your-Own Pottery Business Has 130 Locations — But Anyone Can Use Her Tips for Creating a Customer-First Experience

    Together, the pair has crafted innovative menus and an even more impressive tapas service. One customer, Mike C., visited the restaurant on a post-holiday trip and still remembers his server’s name today.

    “Service makes the meal, and it can break the meal,” Mike says. “Meg — because I do remember her name — she was really great, super friendly, nice and casual but professional. The service that we got was attentive but not overbearing. I’m not looking for them to come up and check on me every second, but I also don’t want to have to look around when I need them. That’s service: learning that knowledge, that experience, that know-when-to and when-not-to.”

    Cole says she isn’t sure if the sixth sense for exceptional service can be taught, but she encourages her team to develop pride in their work. She notices a clear improvement in service when servers treat their work as a craft and feel empowered to add their own personal touch.

    Related: Expert Strategies to Add to Your Small Business’s Playbook This Tax Season

    It also helps to have a passionate chef running the show. “I think the most important thing, too, is [Mimi is] an amazing leader, and that, to me, speaks more than being an amazing chef because when you can lead a team of people and really inspire in our industry, then that translates into the guest experience,” Cole says.

    Building a dream team doesn’t happen by mistake. Cole uses two hiring tactics to find employees who show promise. First, she reviews the applicant’s resumé and researches their previous workplaces to understand their past work cultures and see if they would be a natural fit at Sur Lie. Second, she asks about the applicant’s favorite workplace and why, gaining insight into their values and cultural contributions.

    From hiring to inventory, Cole does it all, emphasizing the importance of organization to stay on top of everything. Before becoming a restaurateur, Cole worked as a healthcare manager and studied entrepreneurship, gaining expertise in team and organizational structure that still serves her today.

    “Having systems and processes in place is super important to providing quality and consistency,” she says. “[That translates into] having your team really engaged in the work they’re doing and being able to hold people accountable. It should be a well-oiled machine, and there should be very clear expectations and one way of doing things.”

    Related: The Training (and Business) Philosophy That Sets This Self-Defense Studio Apart

    With such systems and expectations in place, Cole is able to protect her limited time. She owns and runs two other eateries in Maine in addition to Sur Lie. Something as simple as creating an Amazon order request form or preparing a meeting agenda saves her precious time and ensures she addresses every issue with her team.

    Reading customer reviews is always an item on Cole’s to-do list and an essential component of Sur Lie’s well-oiled machine. She appreciates anyone who takes the time to provide feedback, but she really takes it to heart when it comes from a local resident.

    When she first took over the restaurant Gather, she invested in the brand by hiring experts and sourcing local ingredients, resulting in higher menu prices. “[We were] hearing from the community that it was getting too expensive,” Cole says. “We definitely took that feedback seriously because you’re not a destination restaurant in a small town. Usually, you’re supported by your community and the locals. So that was something that we shifted and tried to make a little more approachable for people, especially in a family-oriented community.”

    Related: What Small Businesses Can Learn from Yelp’s Trend Tracker

    From starting in healthcare to owning three restaurants, Cole continues to steer her entrepreneurial journey with these key lessons:

    • Pick up transferable skills along the way. The entrepreneurial journey is often a winding road, but skills from other industries can prove invaluable in the long run.
    • Listen to locals. Community is the driving force behind all local businesses. Make sure to listen to locals and value their opinions to foster long-term loyalty.
    • Get a good read on the market. Determine if there’s a hole in the market your business can fill and assess how you can differentiate yourself from competitors.
    • Service is a craft. Service leaves a lasting impression, good or bad. Encourage your team to bring their own flair to customer service and take pride in their craft.
    • Protect your time. Set clear expectations with your team on when and how you’re available. Whether it’s a form for inventory requests or an agenda item for the all-hands meeting, having a system in place will help you work smarter, not harder.
    • Hire to enhance your culture. If you don’t invest in your staff’s careers, they won’t invest in the customer experience. Recognize their value and how it aligns with your company culture.

    Listen to the episode below to hear directly from Cole and Mike C., and subscribe to Behind the Review for more from new business owners and reviewers every Thursday.

    Editorial contributions by Erin Palmero and Kristi Lindahl


    Source link

  • 5 Best Classic App Store Games

    5 Best Classic App Store Games


    Canabalt is a classic endless runner where you will race across rooftops and avoid obstacles. With a single button control, eight game mode options, and different runners to choose from, you can run for a high score or just for survival.

    As one of the originals in this genre, Canabalt has you running to survive the destruction around you. You can escape alone or bring another runner along for the journey. Controls are simple allowing you jump across rooftops with a tap. Obstacles and distractions are everywhere, so keep your eyes peeled as you race for safety.

    Canabalt is an endless runner that is easy to pick up and play. With understated, but attractive retro-style graphics and fast-paced background music, the energy will keep you moving, jumping, and running to escape.


    Source link

  • Improve app quality and performance with new Play Console insights


    Posted by Dan Brown, Dina Gandal and Hadar Yanos – Product Managers, Google Play

    At Google Play, we partner with developers like you to help your app or game business reach its full potential, providing powerful tools and insights every step of the way. In Google Play Console, you’ll find the features needed to test, publish, improve, and grow your apps — and today, we’re excited to share several enhancements to give you even more actionable insights, starting with a redesigned app dashboard tailored to your key workflows, and new metrics designed to help you improve your app quality.

    Focus on the metrics that matter with the redesigned app dashboard

    The first thing you’ll notice is the redesigned app dashboard, which puts the most essential insights front and center. We know that when you visit Play Console, you usually have a goal in mind — whether that’s checking on your release status or tracking installs. That’s why you’ll now see your most important metrics grouped into four core developer objectives:

      • Test and release
      • Monitor and improve
      • Grow users, and
      • Monetize with Play

    Each objective highlights the three metrics most important to that goal, giving you a quick grasp of how your app is doing at a glance, as well as how those metrics have changed over time. For example, you can now easily compare between your latest production release against your app’s overall performance, helping you to quickly identify any issues. In the screenshot below, the latest production release has a crash rate of 0.24%, a large improvement over the 28-day average crash rate shown under “Monitor and Improve.”

    screen recording of the redesigned app dashboard in Google Play Console

    The redesigned app dashboard in Play Console helps you see your most important metrics at a glance.

    At the top of the page, you’ll see the status of your latest release changes prominently displayed so you know when it’s been reviewed and approved. If you’re using managed publishing, you can also see when things are ready to publish. And based on your feedback, engagement and monetization metrics now show a comparison to your previous year’s data so you can make quick comparisons.

    The new app dashboard also keeps you updated on the latest news from Play, including recent blog posts, new features relevant to your app, and even special invitations to early access programs.

    In addition to what’s automatically displayed on the dashboard, we know many of you track other vital metrics for your role or business. That’s why we’ve added the “Monitor KPI trends” section at the bottom of your app dashboard. Simply scroll down and personalize your view by selecting the trends you need to monitor. This customized experience allows each user in your developer account to focus on their most important insights.

    Later this year, we’ll introduce new overview pages for each of the four core developer objectives. These pages will help you quickly understand your performance, showcase tools and features within each domain, and list recommended actions to optimize performance, engagement, and revenue across all your apps.

    Get actionable notifications when and where you need them

    If you spend a lot of time in Play Console, you may have already noticed the new notification center. Accessible from every page, the notification center helps you to stay up to date with your account and apps, and helps you to identify any issues that may need urgent attention.

    To help you quickly understand and act on important information, we now group notifications about the same issue across multiple apps. Additionally, notifications that are no longer relevant will automatically expire, ensuring you only see what needs your attention. Plus, notifications will be displayed on the new app dashboard within the relevant objectives.

    Improve app quality and performance with new Play Console metrics

    One of Play’s top goals is to provide the insights you need to build high-quality apps that deliver exceptional user experiences. We’re continuing to expand these insights, helping you prevent issues like crashes or ANRs, optimize your app’s performance, and reduce resource consumption on users’ devices.

    Users expect a polished experience across their devices, and we’ve learned from you it can be difficult to make your app layouts work seamlessly across phones and large screens. To help with this, we’ve introduced pre-review checks for incorrect edge-to-edge rendering, while another new check helps you detect and prevent large screen layout issues caused by letterboxing and restricted layouts, along with resources on how to fix them.

    We’re also making it easier to find and triage the most important quality issues in your app. The release dashboard in Play Console now displays prioritized quality issues from your latest release, alongside the existing dashboard features for monitoring post-launch, like crashes and ANRs This addition provides a centralized view of user-impacting issues, along with clear instructions to help you resolve critical user issues to improve your users’ experiences.

    The quality panel in the redesigned app dashboard in Google Play Console

    The quality panel at the top of the release dashboard gives you a prioritized view of issues that affect users on your latest release and provides instructions on how to fix them.

    A new “low memory kill” (LMK) metric is available in Android vitals and the Reporting API. Low memory issues cause your app to terminate without any logging, and can be notoriously difficult to detect. We are making these issues visible with device-specific insights into memory constraints to help you identify and fix these problems. This will improve app stability and user engagement, which is especially crucial for games where LMKs can disrupt real-time gameplay.

    The quality panel in the redesigned app dashboard in Google Play Console

    The low memory kill metric in Android vitals gives you device-specific insights into low memory terminations, helping you improve app stability and user engagement.

    We’re also collaborating closely with leading OEMs like Samsung, leveraging their real-world insights to define consistent benchmarks for optimal technical quality across Android devices. Excessive wakelocks are a leading cause of battery drain, a top frustration for users. Today, we’re launching the first of these new metrics in beta: excessive wake locks in Android vitals. Take a look at our wakelock documentation and provide feedback on the metric definition. Your input is essential as we refine this metric towards general availability, and will inform our strategy for making this information available to users on the Play Store so they can make informed decisions when choosing apps.

    Together, these updates provide you with even more visibility into your app’s performance and quality, enabling you to build more stable, efficient, and user-friendly apps across the Android ecosystem. We’ll continue to add more metrics and insights over time. To stay informed about all the latest Play Console enhancements and easily find updates relevant to your workflow, explore our new What’s new in Play Console page, where you can filter features by the four developer objectives.


    Source link

  • Debugging Projects in Godot | Kodeco

    Debugging Projects in Godot | Kodeco


    It might come as a surprise, but not all code works on the first try. (Insert surprised copyright-safe yellow electrical rodent here)

    For this reason, most integrated development environments (IDEs) include a debugger that allows the developer to spot and solve issues during the several development iterations. This is illustrated by the following pseudocode:

    while developing == true:
        code
        test
        debug

    When developing a game, however, there are other issues to think about, such as game balance or verifying behaviors that might be too fast or subtle to notice during gameplay.

    Think about it. You carefully crafted your game’s challenge level, so you want to make sure it’s up to the challenge. But how can you count the number of enemies in a game when they’re moving around and shooting at you?
    You might want to check the game balance. Is the number of enemies spawned at a given instant what you expect? Did the power-up add the damage boost you expected?

    These are just a few of the questions you might want to answer while testing your game. This is where Godot’s debug tools come in handy, helping you test and verify all that.

    Getting Started

    The example project is the same from the Publishing Your Godot Project to itch.io tutorial. However, for this article, the code was changed to enhance the gameplay experience. Unfortunately, the game broke in the process and you need to find what’s wrong with it using the debug tools. How convenient! :]

    You can download the project using the Download materials links at the top and bottom of this article. Note that this project requires Godot 4.3 or newer to run.

    The starting project has the same structure as in the previous article, but three files have changed: projectile.gd, enemy_ship.gd, and main_game.gd.

    Now is a good time to download and run the project to review how it’s working and notice how the bugs influence the game. The main issue you’ll notice is that it’s impossible to destroy the enemy ships, although they can destroy your ship, so it’s debugging time!

    Overview of the Debug Tools

    Godot has a set of powerful debug tools you can use to review code for logic errors, or graphics for performance issues, or even to get an x-ray of how the game is using its processing time.

    Although there’s a Debug menu at the top of the screen, this article will focus on the tools accessible through the Debugger panel at the bottom of the screen, because these are the tools that gather information when executing the project through the Run the project button.

    Debugger Panel

    The debugger panel, located at the bottom of the screen by default, is accessible from the Debugger option at the bottom of the window, to the right of the Output option. The following picture shows the debug panel:

    The debug panel

    At the panel’s top, you can see a few tabs. From left to right, the tabs are:

    1. Stack trace: Shows the execution stack, the context and its variables, and allows for controlling how the game executes during the debug session. You’ll learn more about this tab later in this article.
    2. Errors: Shows the error and warning messages during the game execution.
    3. Profiler: Shows which code is running and how it affects the game performance. You’ll learn more about this tab later in this article.
    4. Visual profiler: Displays a graph showing which code is running and how much time it takes for execution. You’ll learn more about this tab later in this article.
    5. Monitors: Contains graphs of game information, such as frames per second (fps), memory usage, scene nodes, and more. The data from the debug session is saved even after the session is over, so it’s possible to review it even after execution.
    6. Video RAM: Shows a list of resources and how much video RAM they use while running, as well as the grand total at the top of the panel.
    7. Misc: Monitors and identifies the control nodes clicked during runtime.
    8. Network Profiler: Contains the list of all nodes communicating over Godot’s multiplayer API and how much data each one of them received or sent during the debug session.

    This article focuses on tabs 1, 2, 3, 4 and 5. However, feel free to examine the others using the same project. Some of them, such as Network Profiler won’t have any interesting information, though, as the game doesn’t use the multiplayer API in any point.

    Using Breakpoints

    After executing the game, you should have noticed that the main issue is that it’s impossible to destroy the enemy ships. So, logically, there must be a problem with the function invoked when damaging the enemy ships — maybe the ships don’t take damage when they should?

    To test if this is true, examine the function that deals damage to the enemies: open projectile.gd and find the damage_body function. The function code is:

    func damage_body(body: Node2D) -> void:
        # 1
        body.take_damage(3)
        # 2
        create_explosion() 
        # 3
        queue_free()       

    This code does the following:

    1. When the bullet collides with the enemy ship, it reduces the ship’s health by 3 points;
    2. An explosion appears on the point where the collision happened;
    3. The bullet is removed from memory;

    This is a straightforward function, and its logic seems to be correct. How can it not be working? Wouldn’t it be great if there was a way of getting a deeper look at how the code is working? That is where breakpoints come in, allowing you to halt the code execution and dig deeper to discover the problem.

    Breakpoints

    When analyzing code, the error might not be obvious just by looking at the code; you might want to have a look at the code during runtime. To do just that, you’ll need to use breakpoints and watches, which work together to assist and verify what the code is doing.

    When you define a breakpoint, Godot knows it will need to execute the project normally up to that point. After that, it halts execution and allows you to control how fast the code should execute, and lets you see which code executes in case of conditionals or loops.

    The description should be kind of abstract now, but you’ll see that in practice it’s very simple and handy!


    Source link

  • The Fourth Beta of Android 16


    Posted by Matthew McCullough – VP of Product Management, Android Developer

    Today we’re bringing you Android 16 beta 4, the last scheduled update in our Android 16 beta program. Make sure your app or game is ready. It’s also the last chance to give us feedback before Android 16 is released.

    Android 16 Beta 4

    This is our second platform stability release; the developer APIs and all app-facing behaviors are final. Apps targeting Android 16 can be made available in Google Play. Beta 4 includes our latest fixes and optimizations, giving you everything you need to complete your testing. Head over to our Android 16 summary page for a list of the features and behavior changes we’ve been covering in this series of blog posts, or read on for some of the top changes of which you should be aware.

    Android 16 Release timeline showing Platform Stability milestone in April

    Now available on more devices

    The Android 16 Beta is now available on handset, tablet, and foldable form factors from partners including Honor, iQOO, Lenovo, OnePlus, OPPO, Realme, vivo, and Xiaomi. With more Android 16 partners and device types, many more users can run your app on the Android 16 Beta.

    Android 16 Beta Release Partners: Google Pixel, iQOO, Lenovo, OnePlus, Sharp, Oppo, RealMe, vivo, Xiaomi, and Honor

    Get your apps, libraries, tools, and game engines ready!

    If you develop an SDK, library, tool, or game engine, it’s even more important to prepare any necessary updates now to prevent your downstream app and game developers from being blocked by compatibility issues and allow them to target the latest SDK features. Please let your developers know if updates to your SDK are needed to fully support Android 16.

    Testing involves installing your production app or a test app making use of your library or engine using Google Play or other means onto a device or emulator running Android 16 Beta 4. Work through all your app’s flows and look for functional or UI issues. Review the behavior changes to focus your testing. Each release of Android contains platform changes that improve privacy, security, and overall user experience, and these changes can affect your apps. Here are several changes to focus on that apply, even if you aren’t yet targeting Android 16:

      • Broadcasts: Ordered broadcasts using priorities only work within the same process. Use other IPC if you need cross-process ordering.
      • ART: If you use reflection, JNI, or any other means to access Android internals, your app might break. This is never a best practice. Test thoroughly.
      • 16KB Page Size: If your app isn’t 16KB-page-size ready, you can use the new compatibility mode flag, but we recommend migrating to 16KB for best performance.

    Other changes that will be impactful once your app targets Android 16:

    Get your app ready for the future:

      • Local network protection: Consider testing your app with the upcoming Local Network Protection feature. It will give users more control over which apps can access devices on their local network in a future Android major release.

    Remember to thoroughly exercise libraries and SDKs that your app is using during your compatibility testing. You may need to update to current SDK versions or reach out to the developer for help if you encounter any issues.

    Once you’ve published the Android 16-compatible version of your app, you can start the process to update your app’s targetSdkVersion. Review the behavior changes that apply when your app targets Android 16 and use the compatibility framework to help quickly detect issues.

    Two Android API releases in 2025

    This Beta is for the next major release of Android with a planned launch in Q2 of 2025 and we plan to have another release with new developer APIs in Q4. This Q2 major release will be the only release in 2025 that includes behavior changes that could affect apps. The Q4 minor release will pick up feature updates, optimizations, and bug fixes; like our non-SDK quarterly releases, it will not include any intentional app-breaking behavior changes.

    Android 16 2025 SDK release timeline

    We’ll continue to have quarterly Android releases. The Q1 and Q3 updates provide incremental updates to ensure continuous quality. We’re putting additional energy into working with our device partners to bring the Q2 release to as many devices as possible.

    There’s no change to the target API level requirements and the associated dates for apps in Google Play; our plans are for one annual requirement each year, tied to the major API level.

    Get started with Android 16

    You can enroll any supported Pixel device to get this and future Android Beta updates over-the-air. If you don’t have a Pixel device, you can use the 64-bit system images with the Android Emulator in Android Studio. If you are currently on Android 16 Beta 3 or are already in the Android Beta program, you will be offered an over-the-air update to Beta 4.

    While the API and behaviors are final and we are very close to release, we’d still like you to report issues on the feedback page. The earlier we get your feedback, the better chance we’ll be able to address it in this or a future release.

    For the best development experience with Android 16, we recommend that you use the latest Canary build of Android Studio Narwhal. Once you’re set up, here are some of the things you should do:

      • Compile against the new SDK, test in CI environments, and report any issues in our tracker on the feedback page.

    We’ll update the beta system images and SDK regularly throughout the Android 16 release cycle. Once you’ve installed a beta build, you’ll automatically get future updates over-the-air for all later previews and Betas.

    For complete information on Android 16 please visit the Android 16 developer site.


    Source link

  • Most Coachella Attendees Buy Tickets with Buy Now, Pay Later

    Most Coachella Attendees Buy Tickets with Buy Now, Pay Later


    Coachella, the music festival that occurred across two weekends this month, drew crowds of 125,000-plus attendees each day.

    A report published by Billboard last week shows that most of the crowd, about 60%, used Coachella’s payment plan system to pay for their $600-and-up tickets. The plan allows attendees access to Coachella with an upfront cost of as little as $49.99.

    Tickets started at $649 for the first weekend of Coachella from April 10 through 12 and $600 for the second weekend from April 17 through 19. People reported that tickets used to cost $429 per weekend in 2020. When Coachella started in 1999, tickets were $50.

    Related: Jeff Bezos Was Caught on Video Dancing at Coachella, But It’s His ‘$12 Amazon Shirt’ That Has the Internet in Stitches

    The festival first began offering the buy-now-pay-later option in 2009, and at the time, only 18% of attendees tapped into it, per People.

    Coachella music festival 2025. Credit: Getty Images

    Coachella partnered with ticketing company AXS to offer the buy now, pay later payment plan, which enables the festival goer to pay off their ticket over three months. Coachella does not charge interest for the ticket purchase, but does require that those who opt for the payment plan pay a $41 fee for using the service, which amounts to about 8% of the ticket price. The average credit card interest rate, in comparison, is about 20%.

    Most fans bought tickets to Coachella after the festival announced its musician lineup in November, revealing that Lady Gaga, Travis Scott, Green Day, Post Malone, and Benson Boone were headliners. Anyone who bought tickets before Jan. 25 and opted for the payment plan had the price of their ticket divided into three equal payments, with the final payment deducted from the attendee’s account in March, per Billboard.

    If payments were more than 10 days late, the order was automatically cancelled and the fan given a credit for future festivals. The credit expires one year after being issued.

    Related: Google’s Founders Once Interviewed Their CEO at Burning Man. Now the Desert Festival Is Struggling to Sell Tickets.

    Coachella makes more than $115 million in ticket sales on average per year. Artists who perform at the festival can earn up to $5 million per weekend.


    Source link

  • Alchemer’s commitment to data quality

    Alchemer’s commitment to data quality


    Recent news of a $10 million survey fraud scheme is sending shockwaves through the market research industry. As investigators uncover the extent of this nearly decade-long scheme, one thing is clear: the integrity of survey data cannot be taken for granted. 

    As a trusted market research provider, this story is a powerful reminder of why Alchemer’s commitment to ethical research and uncompromising data quality is non-negotiable.  

    Great insights start with quality data  

    To put it simply, insights that come from bad data lead to bad decisions. Inaccurate or fraudulent survey responses skew results, erode customer trust, and derail entire programs and strategies.  

    The spread of AI-powered bots and sophisticated fraudsters poses a significant threat to the integrity of market research studies and the industry as a whole. Survey fraud isn’t just a technical hurdle to overcome—it’s an ethical challenge that impacts researchers, organizations, and the people they aim to serve. 

    This is why Alchemer’s Research Solutions Team combines advanced technology with human oversight to detect and eliminate fraudulent responses before they compromise a research study.  

    Alchemer’s approach to fraud prevention  

    From device fingerprinting and in-survey behavioral analysis to manual response audits, Alchemer takes a multi-step approach to data quality and fraud prevention. With rigorous processes and standards, Alchemer ends up scrubbing 10–15% more fraudulent data than other providers, ensuring the insights you receive are complete, legitimate, and human.  

    Step 1: Pre-survey forensic screening 

    Before a respondent ever sees a question, they are screened using real-time device-level fingerprinting and forensic analysis. This initial checkpoint evaluates more than 40 unique markers and assigns a fraud score based on the likelihood and type of fraudulent behavior detected. Helping to identify and block: 

    • Bots and automated behavior 
    • Emulators and simulators 
    • Residential proxies and data center IPs 
    • Dark web-originated traffic 
    • Location and browser spoofing 
    • Device/account duplication 
    • Device oscillation and velocity anomalies 

    Step 2: Post-survey human and algorithmic review 

    After a respondent completes a survey, there is an additional step to ensure data accuracy. Using advanced technology and human expertise, the Research Solutions Team reviews open-ended answers for unnatural language patterns, odd phrasing, or copy/paste behavior, and flag responses that move too quickly or don’t follow logical patterns. 

    This extra layer of review helps identify: 

    • Contradictory or nonsensical answers 
    • Pre-written or scripted responses 
    • Unusually fast completion times 
    • Responses that don’t reflect real human input 

    Preventing survey fraud together 

    Maintaining data integrity is a shared responsibility and that responsibility starts with awareness and vigilance. As partners in the research process, the Research Solutions Team is committed to helping you uphold the highest standards of data quality.  

    In every client engagement the Reseach Solutions Team recommends the following best practices:  

    1. Stay informed: Keep up with evolving best practices in survey design and fraud prevention. From smart screening techniques to subtle shifts in question phrasing, even small adjustments make a big impact in deterring fraud and protecting the reliability of your data. 
       
    1. Embed quality checks throughout: Build data validation, logic traps, and timing checks into your surveys from the start. This proactive approach allows you to identify potential issues in real time and significantly reduces the risk of bad data slipping through the cracks. 
       
    1. Be vigilant: Pay close attention to red flags, such as inconsistent answers, patterned responses, or unusually fast completions. These warning signs may indicate fraudulent behavior and should prompt a deeper review. 
       
    1. Collaborate with the Research Solutions Team: When something seems off, they are there to help. Our team of experts can assist in identifying potential anomalies, adjusting your survey setup, and reinforcing your fraud prevention strategies.  

    Confidence with every decision  

    At Alchemer, we will continue to prioritize data quality in everything we do, because we understand that without good data, even the most sophisticated study loses its value.  

    Trust in research begins with trust in data, and that’s a responsibility we take seriously every day. 

    For more information about our data quality practices or to discuss your current or future research projects, please contact the Research Solutions Team today. 


    Source link

  • Kodeco Podcast: All the Conferences – Podcast V2, S3 E3

    Kodeco Podcast: All the Conferences – Podcast V2, S3 E3


    Thank you for your patience as extraordinary life events turned our schedule topsy turvy. Here, at last, is our All the Conferences episode, featuring iOS community luminaries Mikalea Caron and Matt Heaney. Whether you’re a seasoned speaker or just conference-curious, this episode is packed with insights on how to choose the right events, travel smart, and even lower your costs—sometimes all the way down to zero!

    [Subscribe in Apple Podcasts] [Listen in Spotify] [RSS Feed]

    Interested in sponsoring a podcast episode? Check out our Advertise With Kodeco page to find out how!

    Show Notes

    Join Suz and Dru as they sit down with indie iOS developer Mikaela Caron and Atomic’s new mobile engineering manager Matt Heaney. These two are not only passionate conference attendees—they’re frequent speakers, community leaders, and strong advocates for developer connection and growth. From how to break into speaking, to choosing your first conference, to eating your way through the Swift world tour, there’s something here for every dev.

    Highlights from this episode:

    • How submitting a CFP (Call for Proposals) could get you into conferences for free—and help launch your speaking career.
    • Tips for discovering new conferences, including the magic of CocoaConferences.com.
    • How to network at conferences, even if you’re introverted—and why just saying “it’s my first time” can be a superpower.

    Mentioned in This Episode

    Contact Matt, Mikalea, and the Hosts

    Follow Kodeco

    Where to Go From Here?

    We hope you enjoyed this episode of our podcast. Be sure to subscribe in Apple Podcasts or Spotify to get notified when the next episode comes out.

    Hoping to learn more about a particular aspect of mobile development or life and work as a dev? Please write in and tell us and we’ll do our best to make that happen! Write in too if you yourself would like to be a guest or your have a particular guest request and we’ll see what we can do. Drop a comment here, or email us anytime at podcast@teamkodeco.com.


    Source link

  • Pixel’s Call Notes hints at automatic call recording for the US

    Pixel’s Call Notes hints at automatic call recording for the US


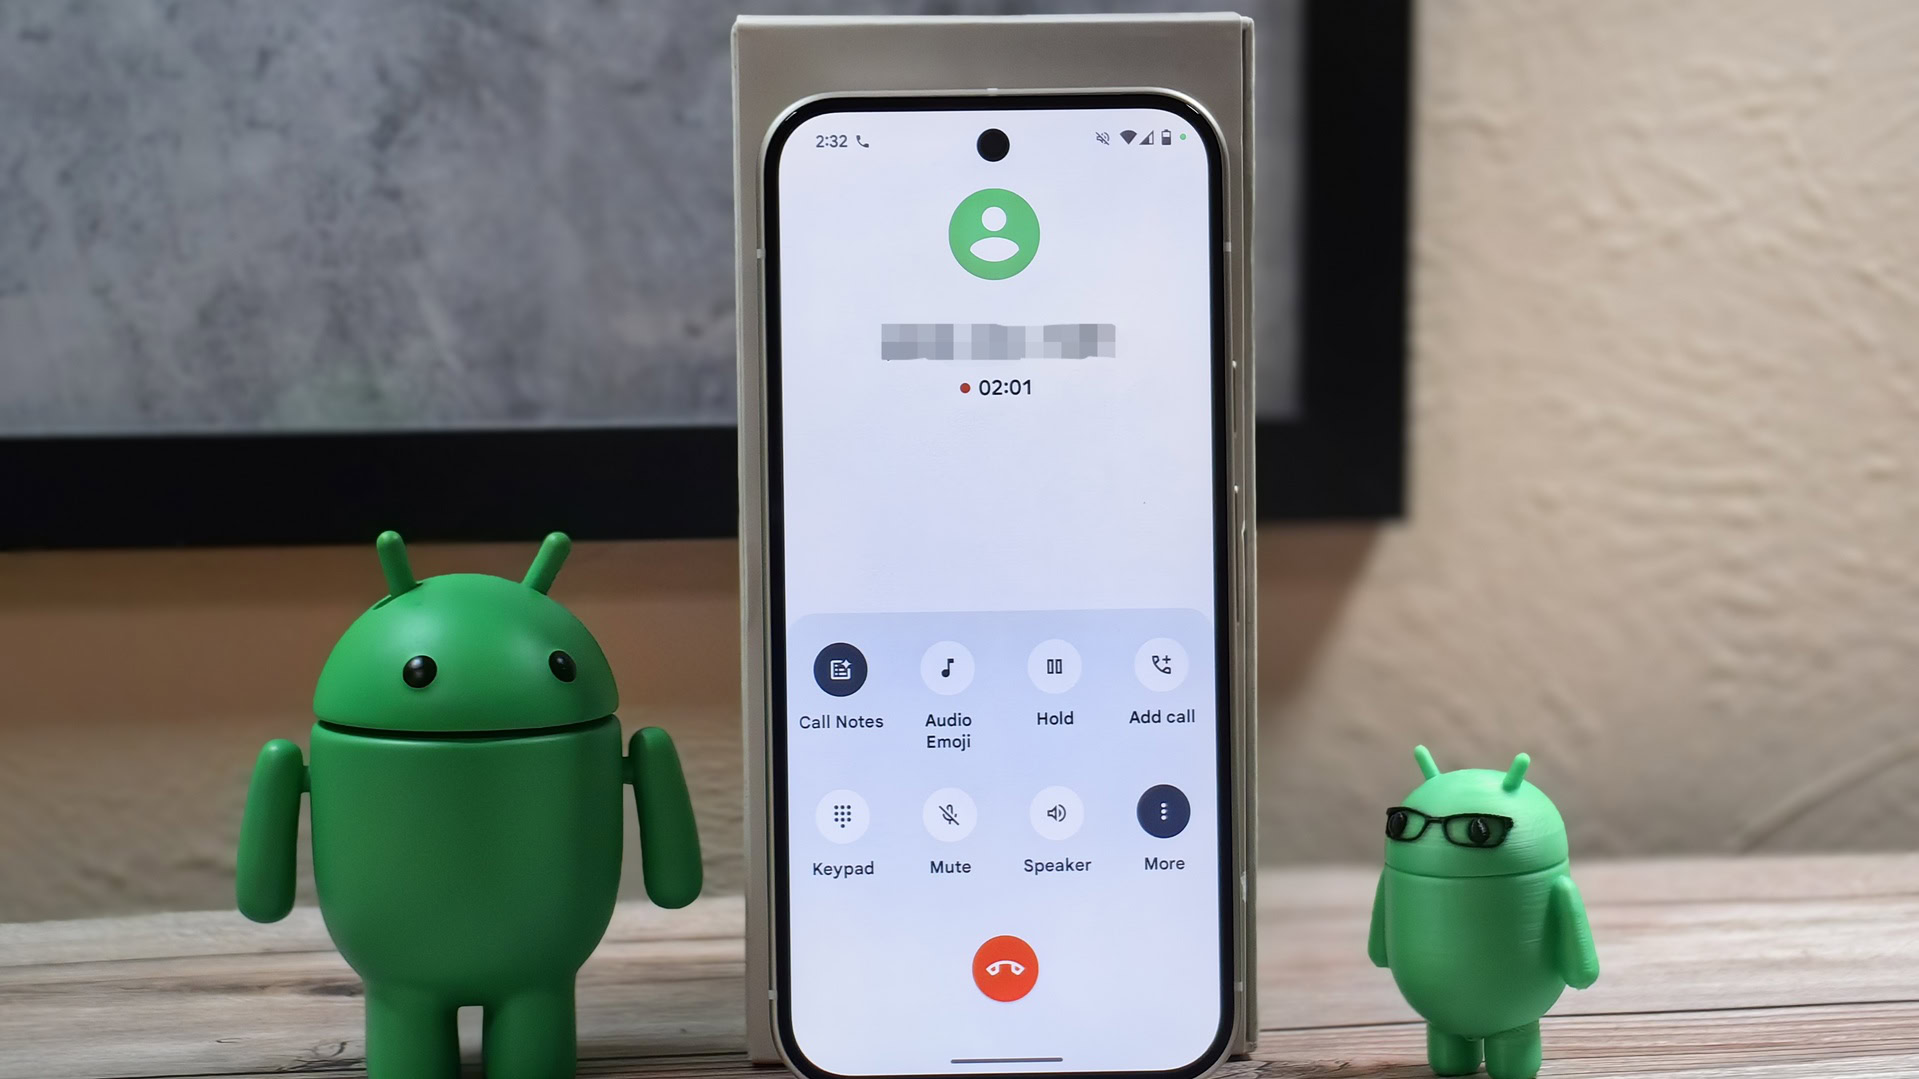
    Pixel 9 phone app

    Mishaal Rahman / Android Authority

    TL;DR

    • Pixel 9 phones in the US currently require manually activating Call Notes on every call to record, transcribe, and summarize them.
    • Google has been spotted testing automatic call recording within the Call Notes feature, indicating that automatic call recording could finally make its way to the US.
    • However, Google has previously stated that automatic activation wasn’t meant for public release and was limited to internal testing only. So the fate of the feature remains in the air.

    The Google Phone app, which is preloaded on several Android flagships, offers call recording in several regions globally, but not in the US (even though you can legally record calls in most states after adequate consent). Instead, users in the US have to use the Pixel 9’s Call Notes feature to record a phone call. However, Call Notes is only available per call, requiring users to consciously activate it whenever they want to record, transcribe, or summarize a phone call. Now, Google has been spotted working on automatic call recording within the Call Notes feature that would make life a lot easier, but we aren’t sure if the company ever plans to release it.

    You’re reading an Authority Insights story on Android Authority. Discover Authority Insights for more exclusive reports, app teardowns, leaks, and in-depth tech coverage you won’t find anywhere else.

    An APK teardown helps predict features that may arrive on a service in the future based on work-in-progress code. However, it is possible that such predicted features may not make it to a public release.

    Currently, on Pixel 9 series devices in the US, you can activate the Call Notes feature during a call to start recording it and receive an AI-generated summary and even the call transcript.

    However, this action is deliberate and manual, as you have to activate the feature by tapping the Call Notes button during every call you want to record. Needless to say, it’s pretty cumbersome if you want to use the feature on many calls.

    But what if you could generate call notes automatically? Google was spotted deliberating on the idea in August 2024, with settings to automatically start Call Notes for various phone calls.

    However, in a statement to Android Police back then, a Google spokesperson mentioned that the code related to automatic activation wasn’t meant for public release and was limited to internal testing only. Consequently, automatic Call Notes did not roll out to Pixel 9 users in the US at the time.

    Curiously, these options still exist within the Phone by Google app. With Phone v172.0 beta, Google has now tweaked the automatic Call Notes option to Automatic Call Recording, switching from an automatic summary to automatic recording. The options are also now limited to these two:

    1. Automatically record unknown numbers
    2. Automatically record these numbers

    We managed to activate the settings page for the feature, and here’s what it looks like right now:

    The above-mentioned new options are similar to the Call Recording settings, which users in several countries already have.

    However, the US doesn’t have the Call Recording feature in the Phone by Google app, so this is one roundabout way of bringing that functionality to the region. The revised settings also don’t mean Call Notes will automatically summarize or transcribe the recordings. But, presuming you have the recordings stored for later use, you can always select to do so later on calls that you need summaries and transcriptions for, so it won’t be all that inconvenient.

    It remains to be seen whether Google finally allows US users to automatically record calls and work its Call Notes magic. For now, users in the US must stick to the manual and cumbersome method of individually beginning Call Notes for every call they need to record, transcribe, and summarize. Given its utility and the progress the company has already made on the feature, we hope it will be released soon.

    Got a tip? Talk to us! Email our staff at news@androidauthority.com. You can stay anonymous or get credit for the info, it’s your choice.


    Source link